Data Analytics and Reporting
You’d be hard-pressed to find any mid-sized to enterprise level business that isn’t already using business analytics in some form or another to inform their decision making. In fact, organisations are becoming increasingly reliant on access to sophisticated analytics and reporting to run almost every aspect of their business efficiently and effectively, and to justify decisions to shareholders or board members.
However, with more data available to us about our business than ever before, we can end up suffering from information overload, and sometimes even lose sight of why we started measuring and reporting on in the first place. In fact, what we initially set out to achieve by collecting and analysing business data and creating reports can end up having the reverse effect…
Instead of providing actionable intelligence around the operation of the business specific to your various stakeholders, you can end up with a mess of views that don’t actually mean anything to anyone.

Are you using your data effectively?
Do any of the following common data analytics and reporting challenges sound familiar?
- Do you have to manually pull in data from multiple sources – or worse, do you have to view this across multiple interfaces?
- Do you ever feel like you just are measuring ‘stuff’ just for the sake of it?
- Have you fallen into the trap of manually preparing reports, massaging data into complex spreadsheets that can be easily broken, or ‘in-house’ databases, taking time you don’t have and exposing the business to the risk of human error?
- Are you reliant on just one or two skilled resources in your business for your business analytics because the methods you are using are complicated, and not something you feel you could easily do yourself?
Read More
The key to using your business intelligence more effectively lies in automation, simplification and accessibility. Data and reporting automation helps to reduce the amount of time required to compile your reports; simplification and clarity on what you are reporting on helps you to know what exactly you are looking at and why it matters; and making data accessible to the people who need it in the business no matter where they and how they need it allows you to stay on top of issues as they arise.
The goal is to make it easy to see what’s ok and what’s not, and to drill in where you need to, to find out why.
Read Less
Find the right business intelligence solution for you
At Precise Business Solutions we believe in investing in solutions that make life easier for you, that are tailored to your needs and that empower you to be the best you can be. This increasingly extends to business intelligence (BI) too.
Business intelligence and analytics tools are designed to help companies collate and organise structured and unstructured data stored across multiple, disparate systems and put it to good use. The best ones also allow people from the executive level all the way through to the front line to have access to the data they require to streamline decision-making processes day to day. When used effectively, data allows organisations to accurately examine their past and present performance to guide future strategies.
With a range of options available natively across the Epicor Kinetic platform with Epicor Data Discovery, as well as our in-house business analysis expertise, Precise Business Solutions can provide tailored BI and analytics solutions that will help you present your data as those actionable decision points.
Read More
Depending on your needs, we can recommend business intelligence (BI) tools that will help you to use the data in your business more effectively in the following ways:
- Real-time transparency across multiple departments and functions.
- Real-time transparency across multiple departments and functions.
- Consolidation of multiple data streams.
- Identification of important consumer trends.
- Fast answers to crucial business questions.
- Greater insight to exceptions, costs and potential efficiency gains.
- Elimination of information bottlenecks.
- Sophisticated visualisations and alert systems to relay updates to key stakeholders.
Read Less
Analytics and reporting options to suit a variety of business needs
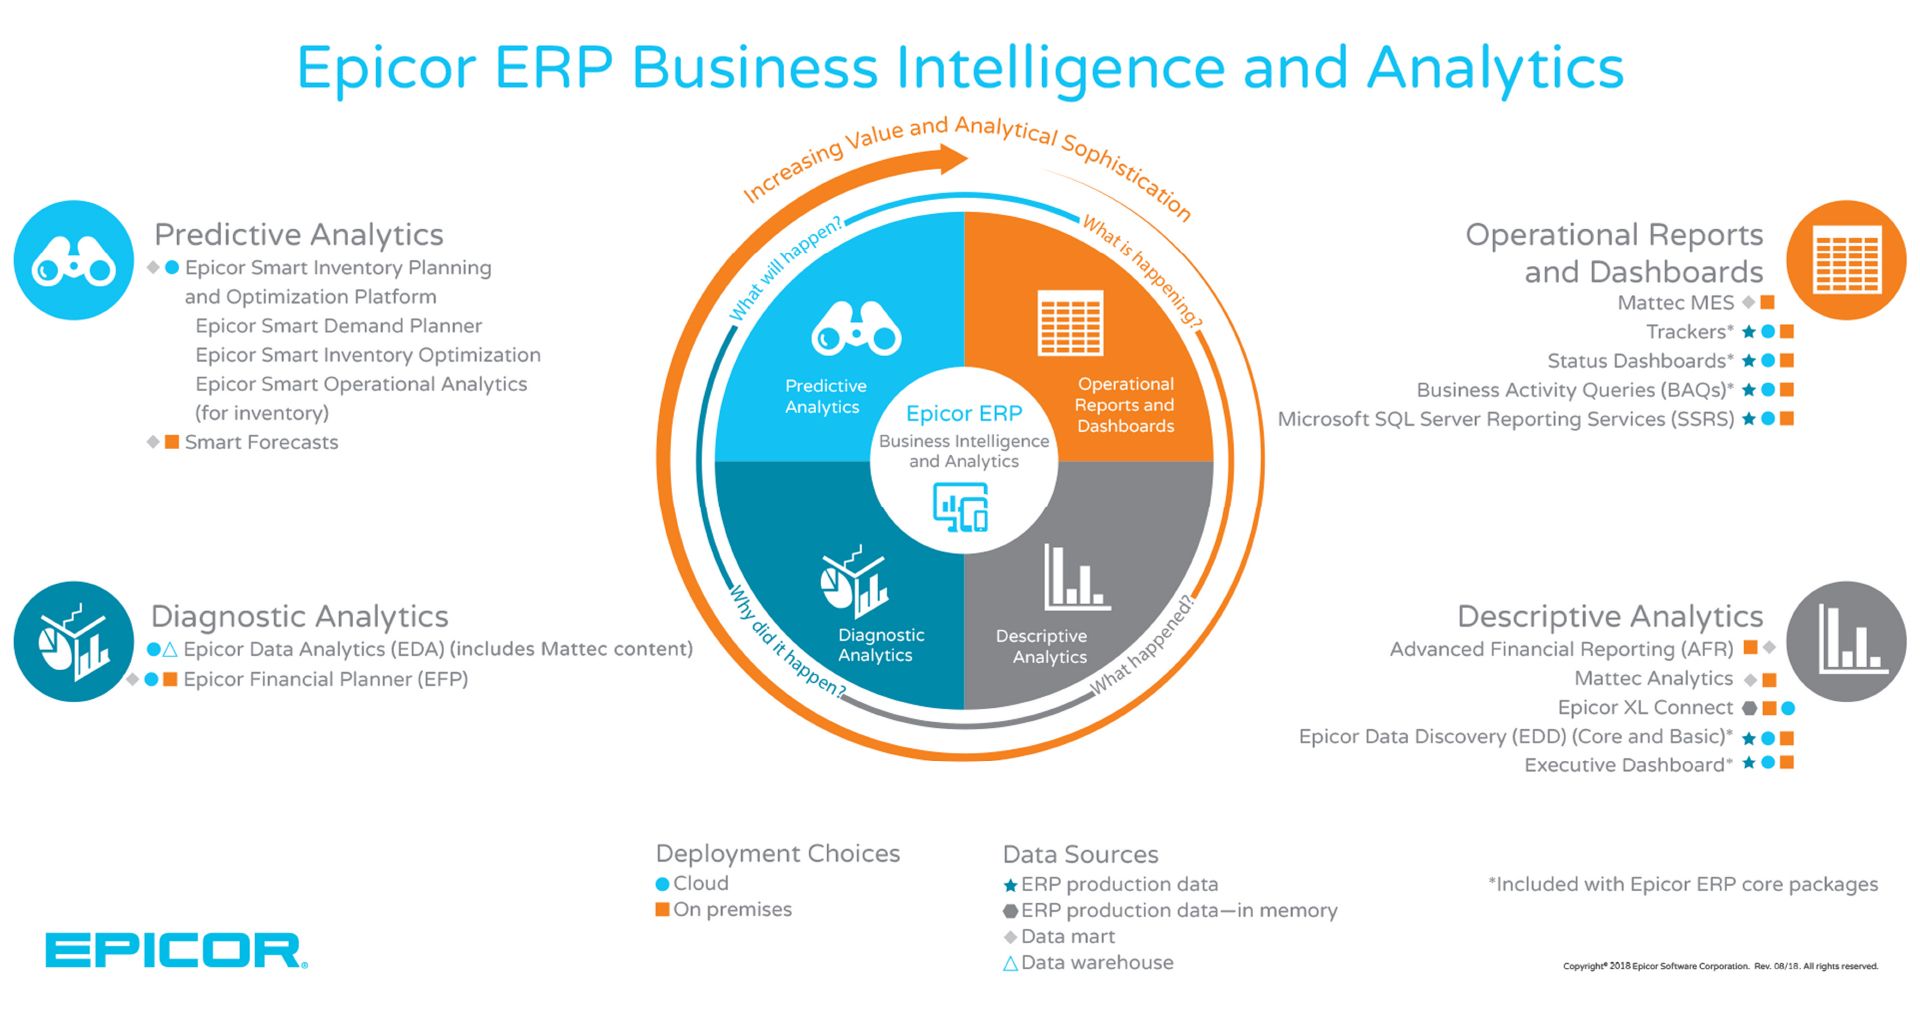
The Epicor Performance Management solution set is designed to cater for a range of purposes relative to where your business is at in its evolution and use of data. The four primary components of this set are: Epicor Data Discovery (EDD), Epicor Data Analytics (EDA), Epicor Financial Planner (EFP) and Epicor Financial Reporter (EFR).
Epicor Data Discovery is about understanding what is happening now in the organisation. EDD starts with role-based, user-centric ’Home Pages’ reflecting the most important elements of the system the you need to run most of your day, from individual application items to elegant visualisations of key metrics telling you the state of your part of the business at that moment in time. This actionable intelligence can help you decide what you need to do next – for example whether something operationally critical really needs your attention.
Read More
Epicor Data Analytics provides powerful business intelligence views at a departmental, organisational or other corporate perspective. Out of the box EDA views are built to be ready for different roles in the business, as with EDD, views can be easily tailored. EDA shows you exactly what has happened in the past and gives you the power to drill into the reasons and patterns behind those outcomes.
Epicor Financial Planner is a powerful corporate budget/forecast management platform for you to collaboratively project what is going to happen and report actual outcomes against those projections, as well as reforecast as needed.
Epicor Financial Reporter is an embedded general ledger (GL) level report development and presentation environment. It’s easy to use, provides summary and detailed, simple or complex financial reports through and across your organisational structure.
If your business is one where we would have to pry Excel out of the dead cold fingers of your Finance Managers, then Epicor XL Connect is another weapon in our arsenal for financial and operational reporting. Using advanced web service integration directly to the Epicor business objects application and security model, XL Connect is a great way to keep using the world’s most widely deployed reporting platform, but do so in a very controlled manner, deeply integrated with your ERP environment.
Similarly, if other emerging analytical platforms out there – such as Power BI – are where you have already made an investment and built a knowledge base within your business, we have great in-house expertise in this area. Using the native Epicor REST API we can securely and selectively expose results of queries built within Epicor itself, leveraging all the native object model and schema elements directly into your reporting models. The flexibility and granularity you can achieve with this BI approach, brings a whole new level of choice to your reporting.
Read Less
Are you ready to take your data and reporting to the next level?
For a more in-depth look into the various BI and analytics tools provided by Precise Business Solutions, contact us to arrange a consultation with one of our expert consultants.

Is Your Business ERP Ready?
Prepare your business for a successful Enterprise Resource Planning (ERP) project with our 12-step guide to success
Ready to Transform Your Operations?
Don’t let outdated systems hold you back. Upgrade to a sophisticated ERP system that offers custom solutions, scalability, and unrivalled support. Contact us today to discover how we can help you maintain your competitive edge.
What Our
Customers Say


